The correlation coefficients between sets of instantaneous body surface potentials are not influenced by the features of the thorax conductor, as it is purely resistive.
Thus, the symmetrical square autocorrelation map (AC-map) of the correlation coefficients between all pairs of instants during the QRS[2] will ideally contain only features due to myocardial events and not to geometrical properties of the thorax.
We previously showed that[3,4], even with a finite number of electrodes, the QRS AC-maps of the same heart at various positions and orientations inside a lead system will always be at higher than 0.95 correlation.
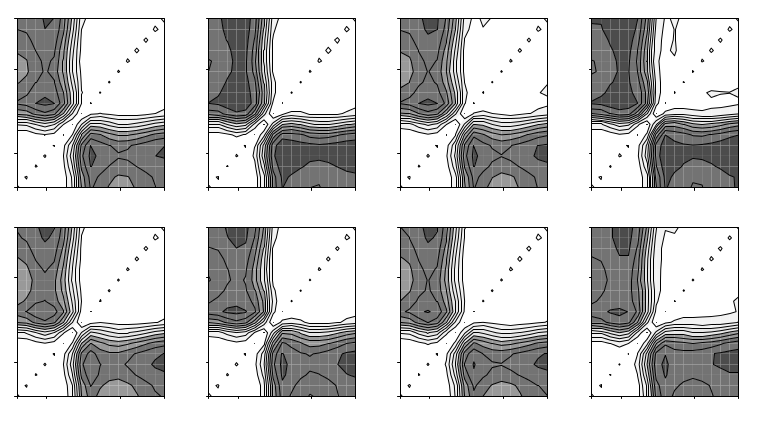
Figure 1: QRS AC-maps of the same simulated activation sequence with different spherical lead systems. The spherical lead system had a radius of 9cm, and was placed at various with displacements up to 6cm on the three spatial directions (top row) and rotated at various angles over a range of 180 degrees (bottom row).
The elimination of the thorax contribution to body surface signals opens the possibility to identify non-invasively individuals with similar ventricular activation and to assess the extent of the variability of this process in a normal population.
AC-maps are displayed with shades of gray to indicate the correlation between instantaneous body surface potential patterns, white representing 1.0 and black -1.0.
We defined the similarity between the AC-maps of two recordings as the correlation coefficient between them.
Two AC-maps at above 0.95 similarity were called equivalent, as differences could have been explained by differences in the volume conductor only.
We considered maps which were not equal to at least another map to be potentially abnormal and eliminated them, then divided the rest in equivalence classes. A prototype recording was choosen for each equivalence class. The prototype recordings were sorted with divisive clustering analysis.
The variability of the patterns (figure 2) is likely due to variability of ventricular excitation spread, because, as shown in figure 1, the same excitation always gives rise to similar AC-maps, irrespective of the position of the electrodes.
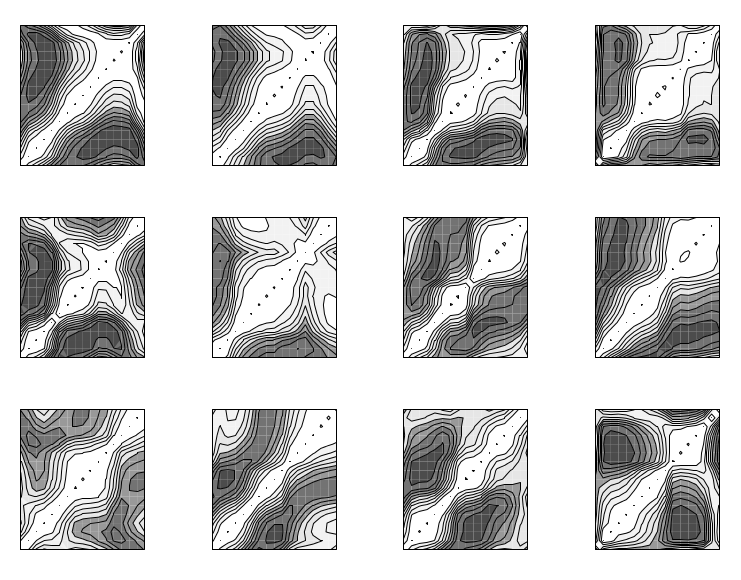
Figure 2: Representative QRS AC-maps of healthy individuals.
The extent to which the ventricular activation process is variable in the normal human population is difficult to assess, as the heart position and orientation in the thorax is itself highly variable[1], enough to take the body surface potentials outside the normal range[6].
In this study we showed that substantial normal variability exists in the ECG source itself, illustrated by the variability of AC-maps of the QRS interval. The results are not surprising given the wide anatomical variability of the human conduction system.
One possible application of these results could be the identification of stricter normal limits of the ECG parameters for subjects belonging to the same activation class.
It could also be possible to match the AC-map type to the conduction system variant, thus allowing the determination of the variant specific to each subject in a non-invasive manner and the development of personalised models of ventricular activation.
![figure [png]](http://dan.corlan.net/reg/DAN0510/prcaucno-fig1.png)
![figure [png]](http://dan.corlan.net/reg/DAN0510/prcaucno-fig2.png)